CBAM's Global Fault Lines: Which Exporting Countries and Sectors Face the Biggest Exposure in 2026
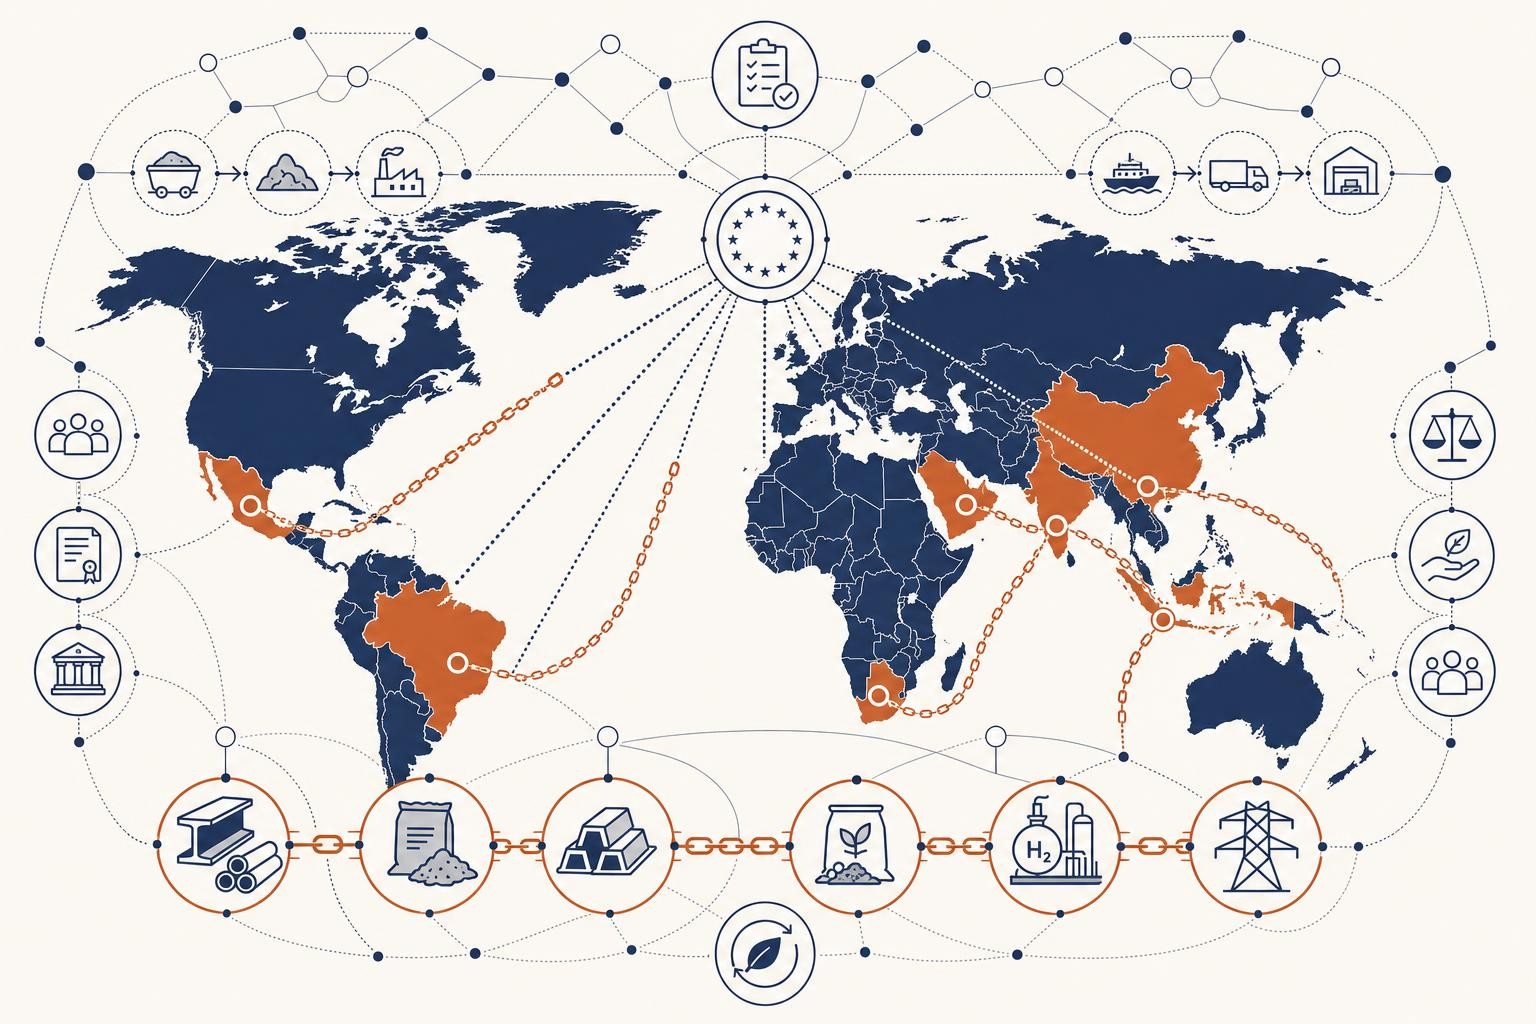
CBAM is live. The compliance machinery is running. In the first week of January 2026 alone, more than 4,100 EU operators secured authorised declarant status, and 10,483 customs declarations covering 1.65 million tonnes of CBAM-covered goods were validated through integrated customs systems. The question for EU importers is no longer "will this apply to us?" It is: "which of our supply origins are most exposed - and what does that mean for our sourcing strategy?"
This piece maps the answer. It is not a compliance guide. It is a trade-flow analysis: which countries and sectors carry the highest CBAM liability, why the gaps between them are so large, and what the pattern means for EU buyers making sourcing decisions today.
The Three Variables That Drive Exposure
Before looking at individual countries, it helps to understand the architecture of exposure. CBAM costs are not simply a function of how much a country exports to the EU. They are driven by three compounding variables:
- Export volume in covered sectors. The more steel, aluminium, cement, fertiliser, electricity, or hydrogen a country ships to the EU, the larger the gross liability.
- Carbon intensity of production. A country using coal-heavy blast furnaces or a carbon-intensive electricity grid embeds far more CO₂ per tonne than one using electric arc furnaces or hydropower. Default values under Implementing Regulation (EU) 2025/2621 are set country-specifically - and carry a 10% mark-up in 2026, rising to 30% from 2028.
- Whether a qualifying domestic carbon price exists. Under Article 9 of Regulation (EU) 2023/956, importers can deduct the carbon price already paid in the country of origin. This is the single most valuable commercial variable in the system - but no country has received formal Commission confirmation of a qualifying Article 9 deduction as of April 2026, though South Korea's K-ETS is the most advanced candidate.
Countries that score high on all three variables - large EU-bound export volumes, carbon-intensive production, and no qualifying domestic carbon price - face the full gross cost with no offset.
The Country Map: Exposure by Origin
Turkey: The Highest Single-Country Commercial Exposure
Turkey sits at the top of the commercial exposure table by a significant margin. Turkey exports approximately 6 million tonnes of steel per year to the EU, with an estimated export value of €6 to €8 billion annually across steel and aluminium. It has no national carbon pricing scheme as of 2026, meaning it faces close to the full gross cost with no Article 9 deduction.
The picture is more nuanced at the production level. Turkey's steel industry relies heavily on electric arc furnace (EAF) technology, which is less carbon-intensive than the blast furnace-basic oxygen furnace (BF-BOF) route dominant in China and India. Using default values for hot-rolled coil via the BF-BOF route, Turkish steel arriving in Q1 2026 would carry a CBAM cost of approximately €100.55 per tonne. For EAF-route steel, the figure is substantially lower. The commercial exposure is therefore driven by volume, not by the worst-case emissions intensity - which is a meaningful distinction for EU importers who can verify actual production routes.
China: The Largest Total Certificate Purchaser
China accounts for roughly 15% of all EU-bound CBAM-covered imports, concentrated in steel and aluminium. China's combined annual steel and aluminium exports to the EU carry an estimated trade value of €8-12 billion. The default embedded emissions value for Chinese steel slab is 3.167 tCO₂e per tonne - more than double the BF-BOF benchmark of 1.370 tCO₂e/t - making Chinese steel among the most expensive to import on a default-value basis.
For unwrought aluminium (CN Code 7601) from China, importers using default values would face CBAM costs of approximately €144.13 per tonne in Q1 2026 - the highest of any major aluminium exporter. By comparison, Turkish aluminium carries a default cost of just €36.37 per tonne, reflecting a cleaner production profile.
China does operate a national ETS, but the carbon price differential is stark. The CN-ETS price stands at approximately $11 per tonne of CO₂, compared to the EU ETS price of approximately €75 per tonne - meaning that even if the scheme qualified for Article 9, it would offset only around 15% of the CBAM certificate obligation for Chinese steel producers. No Article 9 recognition has been granted.
China has accelerated its own ETS expansion, with coverage extended to steel, cement, and aluminium and a move toward absolute caps planned from 2027. Whether that expansion eventually unlocks a partial Article 9 deduction is the most commercially significant open question in CBAM for EU importers of Chinese goods.
India: The Carbon-Intensity Problem
India's exposure is structural rather than purely volumetric. Roughly 90% of India's CBAM-exposed exports to the EU come from iron and steel, with most produced through the blast furnace-basic oxygen furnace route, which emits about 2.5 tonnes of CO₂ per tonne of crude steel - well above the global average of around 1.85 tonnes.
The consequence in landed cost terms is severe. Using default values, Indian hot-rolled coil arriving in Q1 2026 would carry a CBAM cost of approximately €254.13 per tonne - more than double the equivalent Turkish figure. The Global Trade Research Initiative has estimated that Indian exporters may need to cut prices by 15 to 22% to absorb the carbon cost. Early evidence suggests Indian steel exporters are already pivoting toward the Middle East and Africa as a result.
India has no qualifying carbon pricing scheme as of 2026. The World Bank's Relative CBAM Exposure Index flags India as one of the most exposed economies relative to its industrial export base - a finding that reflects both the carbon intensity of its production and its significant EU-bound trade volumes.
The Gulf (GCC): An Aluminium Story
For Gulf Cooperation Council countries, CBAM exposure is almost entirely an aluminium story. Aluminium is the main impact channel for GCC countries, with Bahrain and the UAE the most affected both in absolute terms and relative to GDP; Saudi Arabia and Oman face more limited exposure, while Kuwait and Qatar are largely unaffected.
The nuance here is important for EU importers. Under current CBAM rules, which consider only direct emissions for aluminium, the carbon intensities for primary aluminium made by GCC producers are similar to the EU average and lower than key competitors China and India. This means GCC producers are not necessarily at a disadvantage on a per-tonne cost basis - their exposure is driven by volume and the absence of domestic carbon pricing, not by an extreme emissions intensity gap.
The risk for GCC producers is a future rule change. If the EU were to include indirect emissions (from electricity generation) in CBAM's aluminium scope, the calculus would shift dramatically: GCC smelters run on natural gas-fired power, which carries a significantly higher grid emission factor than the hydropower-intensive grids of some competitors. If indirect emissions were included, total CBAM costs for aluminium could surge from approximately €1 billion to €4.7 billion by 2030. That proposal is not yet adopted, but it is live in Commission discussions.
Smaller Economies: Relative Exposure Can Be Severe
Absolute liability figures favour large economies by definition. The World Bank's Relative CBAM Exposure Index corrects for this by measuring excess carbon payments as a share of GDP or total export value - and the results flag a different set of vulnerable countries.
Mozambique has the highest economic exposure score, with CBAM-related excess payments estimated at 0.6% of GDP, followed by Ukraine at 0.5% and Egypt at 0.2%. Zimbabwe and Georgia also rank highly on the relative index. For Mozambique, the driver is aluminium: the country sends approximately 97% of its aluminium exports to the EU, and its emissions intensity is 7.4 times higher than the average EU aluminium producer.
The counterintuitive finding from the World Bank analysis is that some smaller economies - Ghana, Uzbekistan, Jordan - actually have lower emissions intensities than the EU average in their relevant sectors, giving them a potential competitive advantage under CBAM. Clean producers that emit less than the EU benchmark face no excess carbon payment at all.
The Sector Map: Where the Aggregate Liability Concentrates
Country exposure tells only half the story. The other half is sector composition.
Across iron and steel, aluminium, fertiliser, and cement, total CBAM costs could exceed €12 billion in 2026 - roughly 15% of the value of those imports. But that aggregate masks extreme concentration:
- Iron and steel dominates. The iron and steel sector accounts for roughly 75% of potential CBAM liabilities, with the metals industry as a whole expected to account for 88% of total certificate purchases between 2026 and 2035. BF-BOF steel carries the highest embedded emissions of any mainstream production route, and it is the dominant method in China, India, and much of the developing world.
- Aluminium is a distant second in current liability terms, but carries a tail risk. Aluminium importers could collectively face liabilities near €500 million in 2026 under direct-emissions-only rules. The indirect-emissions question (grid carbon intensity) is the sector's defining regulatory uncertainty.
- Cement is exposed in a different way: its CBAM cost as a share of product value is disproportionately high because cement is a low-value, high-emissions commodity. For certain cement products, CBAM costs could exceed 400% of import value in a high EUA price scenario.
- Fertilisers face a more complex picture, with some products under political pressure for temporary exemption given potential knock-on effects on agricultural input costs.
| Country | Primary Exposure Sector | Qualifying Domestic Carbon Price? | Relative Exposure Level | Key Driver |
|---|---|---|---|---|
| Turkey | Steel | No | Very High (commercial) | Volume: ~6Mt steel/yr to EU, no Article 9 offset |
| China | Steel & Aluminium | Partial (ETS, not yet qualifying) | Very High (aggregate) | High default values (3.167 tCO₂e/t for steel slab); largest total certificate purchaser |
| India | Steel | No | Very High (intensity) | BF-BOF intensity ~2.5 tCO₂e/t; €254/t default cost for HRC |
| Bahrain / UAE | Aluminium | No | High (relative to GDP) | Aluminium export concentration; no domestic carbon price |
| Mozambique | Aluminium | No | Highest relative (0.6% GDP) | 97% of aluminium exports go to EU; intensity 7.4× EU average |
| Ukraine | Steel | Partial | High (relative to GDP, 0.5%) | Steel export dependence on EU market |
| South Korea | Steel & Aluminium | Yes (K-ETS, under assessment) | Moderate (offset potential) | Best-positioned for Article 9 deduction if K-ETS qualifies |
| Russia | Steel & Aluminium | No (qualifying) | Moderate (sanctions limit EU access) | EU sanctions constrain trade more than CBAM itself |
What This Means for EU Importers
The country and sector map above is not just an academic exercise. It has direct implications for EU importers managing sourcing decisions, supplier relationships, and cost forecasting.
Concentration Risk in High-Exposure Origins
If your steel supply chain runs through India or your aluminium through China, you are concentrated in origins where default CBAM costs are among the highest in the system. That is manageable in 2026, when the CBAM factor is just 2.5% - meaning net certificate costs are 2.5% of the gross embedded emissions liability. But the factor ramps steeply: to 48.5% by 2030 and 100% by 2034. At a consensus forecast ETS price of €126 per tonne CO₂e in 2030, a BF-BOF steel importer faces a gross CBAM cost of approximately €172.62 per tonne before the CBAM factor - with a net cost of approximately €83.72 per tonne. Sourcing decisions made today lock in exposure trajectories that will look very different in four years.
The Value of Verified Actual Emissions Data
Default values are intentionally set above average emissions intensity - and the mark-up rises from 10% in 2026 to 30% from 2028. For suppliers in high-exposure origins, the gap between default and actual values can be commercially significant. A Turkish EAF mill producing scrap-based steel has a genuine emissions intensity far below the BF-BOF default. An Indian producer using renewable electricity for part of its process may be able to document a lower intensity than the country average.
Installation-level data, calculated using EU-aligned methodologies and ready for third-party verification, often produces a lower CBAM cost than commercial negotiation can. EU importers who invest in verified supplier data now are building a cost advantage that compounds as the CBAM factor rises.
The data incentive runs both ways. Suppliers who invest in verified emissions reporting can document a lower CBAM cost for their EU customers — making them more competitive than peers relying on default values. EU importers should be asking suppliers in high-exposure origins not just for data, but for verified data. The difference between a default value and a verified actual value can be the difference between winning and losing a contract by 2028.
The Article 9 Watch List
The single most valuable commercial development to monitor is Article 9 qualification. If South Korea's K-ETS receives formal Commission recognition, EU importers of Korean steel and aluminium gain an immediate cost advantage over importers from non-priced origins. If China's expanding ETS eventually qualifies - even partially - the cost differential between Chinese and Indian supply narrows. Importers with diversified supply chains across multiple origins should be tracking this actively.
Sourcing Diversification as a Carbon Hedge
The CBAM exposure map creates a new dimension to supplier diversification. Origins with lower carbon intensity, or with qualifying domestic carbon prices, carry structurally lower CBAM costs. Countries such as Colombia and Albania produce CBAM-covered goods with lower emissions intensities than the EU average, giving them a potential competitive advantage under the mechanism. For EU importers, this is a new sourcing signal that did not exist before 2026.
The Trade-Tension Dimension
No analysis of CBAM's global exposure map is complete without acknowledging the political context. China, India, Russia, and South Africa have voiced opposition to the EU's CBAM, saying it amounts to protectionism, with some countries raising questions about its compatibility with WTO rules. In May 2025, Russia initiated WTO dispute proceedings formally challenging the compatibility of the EU's carbon border adjustment and emissions trading system with WTO agreements.
The EU's legal defence rests on GATT Article XX - measures necessary to protect human, animal, and plant life, and the conservation of exhaustible natural resources. The EU also points to the Article 9 deduction mechanism as evidence that the policy is not discriminatory: any country that prices carbon domestically can reduce its exporters' CBAM liability, keeping the revenue at home rather than transferring it to the EU budget.
The tension is real, but it should not distort EU importers' compliance planning. WTO dispute proceedings take years to resolve, and the WTO Appellate Body remains non-functional. CBAM obligations apply regardless of the outcome of any legal challenge. The more productive question for importers is not whether CBAM will survive legal challenge, but how to manage exposure while it does.
The Trajectory: 2026 Is the Cheap Year
One final point that the country and sector data can obscure: 2026 is structurally the lowest-cost year in the CBAM schedule. The CBAM factor of 2.5% means that net certificate costs are a fraction of the gross embedded emissions liability. The greatest single-year increase in CBAM costs - estimated at €12 billion - comes in the first year of the definitive phase, despite only 2.5% of free allocations being removed, because all embedded emissions above the benchmark become liable from the outset. But costs then escalate year-by-year as free allowances decline toward zero by 2034 and EUA prices are projected to rise.
The exposure map drawn in 2026 is the baseline. The financial stakes attached to it multiply every year.
The Sourcing Takeaway
CBAM has introduced a new axis into every EU import decision involving covered goods: the carbon cost of origin. The exposure map is not flat. Turkey carries the highest commercial exposure by volume. China carries the highest aggregate certificate liability. India carries the most severe per-tonne cost penalty due to production intensity. The Gulf faces concentrated aluminium exposure with a tail risk from indirect emissions rules. And a set of smaller developing economies - Mozambique, Ukraine, Georgia - face disproportionate exposure relative to their economic size.
For EU importers, the practical implication is threefold: understand your concentration in high-exposure origins, invest in verified supplier data to escape the default-value penalty, and track Article 9 developments as the single most valuable commercial variable in the system.
The CBAM factor is 2.5% today. It will not stay there.
Related reading
The UK-EU ETS Linkage Negotiation: What It Means for CBAM Exemption - and When
UK goods entering the EU face CBAM charges today - with no carve-out. The only route to exemption runs through ETS linkage. Here's the state of that negotiation, what it would actually change, and how to plan under uncertainty.
CBAM's Missing Half: What the Temporary Decarbonisation Fund Means for EU Exporters
CBAM equalises carbon costs on imports but leaves EU exporters exposed as free allocation disappears. This post explains the export carbon leakage gap, the proposed Temporary Decarbonisation Fund, and what exporters should do now.

CBAM and Customs Special Procedures: Why Inward Processing Defers Your Obligation, Not Cancels It
Inward processing doesn't exempt you from CBAM - it defers it. Here's exactly when the obligation triggers, what data you need to hold, and who must be the authorised declarant.