Your 2026 CBAM Certificate Bill: A Step-by-Step Cost Calculator Guide
You now have real numbers to work with. The European Commission published the first official CBAM certificate price on 7 April 2026 - EUR 75.36 per tonne of CO₂e for Q1 2026 - and followed it with EUR 75.28 per tonne of CO₂e for Q2 2026. That means every EU importer of steel, aluminium, cement, fertilisers, electricity, or hydrogen can now calculate, to the euro, what their 2026 certificate obligation looks like.
This guide is a practical walkthrough. It is not about what CBAM is, or how the phase-in schedule evolves to 2034 (we have separate posts on both). It is about sitting down with your import data and producing a number your finance team can budget against.
The Core Formula
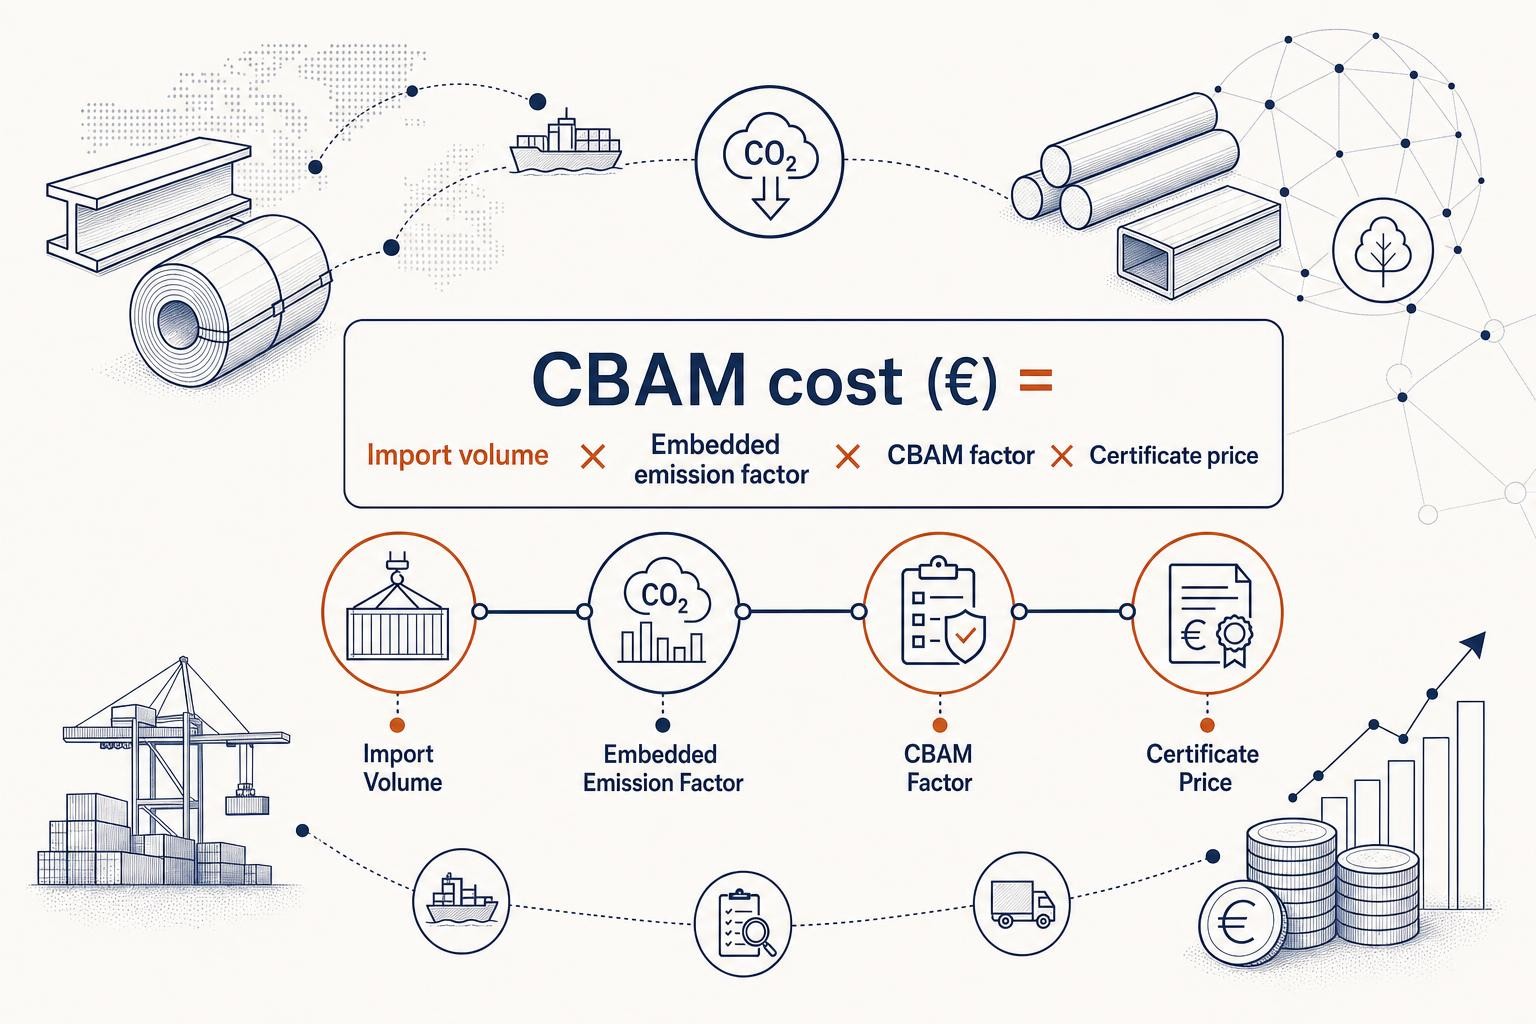
Every CBAM cost estimate starts from the same four-variable equation:
CBAM cost (€) = Import volume (t) × Embedded emission factor (tCO₂e/t) × CBAM factor × Certificate price (€/tCO₂e)
That is it. Four inputs, one output. The rest of this guide explains where each input comes from and what can go wrong if you get it wrong.
This formula gives you your gross certificate obligation before any deduction for a carbon price already paid in the country of origin (the Article 9 deduction). If your supplier's country operates a qualifying carbon pricing scheme, the verified amount paid can be subtracted. For most importers in 2026, no deduction applies — but it is worth checking with your supplier.
Input 1: Import Volume
Where to get it: Your customs declarations (SAD/import entry data) or your ERP system. The figure you need is the net mass in tonnes of CBAM-covered goods imported in the relevant quarter or year.
A few things to watch:
- The unit is net mass (the weight of the goods themselves, excluding packaging). Check your CN code documentation - some products are declared in supplementary units (e.g. number of items) and you will need to convert.
- The 50-tonne annual de minimis threshold introduced by the Omnibus Regulation (EU) 2025/2083 means importers whose total CBAM goods imports stay below 50 tonnes per year are fully exempt (electricity and hydrogen have no such threshold). If you are well above 50 tonnes, proceed. If you are borderline, check the aggregation rules carefully.
- For quarterly budgeting, split your annual import forecast by quarter. Your Q1 bill uses the Q1 certificate price; Q2 uses the Q2 price; and so on.
Input 2: Embedded Emission Factor
This is the tonnes of CO₂ equivalent embedded in each tonne of product you import. It is the variable with the biggest spread - and the biggest risk if you get it wrong.
Actual vs. default values
You have two options:
Option A - Verified actual data. Your non-EU supplier provides installation-level emissions data, calculated under the methodology in Implementing Regulation (EU) 2025/2547 and verified by an accredited third-party verifier. This is the number that reflects what was actually emitted at that specific plant.
Option B - Default values. If your supplier cannot or does not provide verified data, you fall back on the country-specific default values published in Implementing Regulation (EU) 2025/2621. These are country-average emission intensities - and they carry a deliberate mark-up.
The default value mark-up: why it matters
Default values under IR 2025/2621 carry a mark-up of 10% above country-specific averages in 2026, rising to 20% in 2027 and 30% from 2028 onward for steel, cement, aluminium, and hydrogen. The mark-up is intentional - it is designed to pressure exporters into providing actual data. The practical effect is that using defaults inflates your certificate obligation compared to what verified actual data would produce.
For steel, the gap can be dramatic. The default embedded emissions value for Chinese steel slab is 3.167 tCO₂e per tonne under IR 2025/2621 - more than double the BF-BOF benchmark of 1.370 tCO₂e/t. A Turkish BF-BOF mill with actual emissions of around 1.5 tCO₂e/t would be assessed at a significantly higher default if verified data is not provided.
Representative emission factors for planning purposes:
| Product | Production route | Typical actual (tCO₂e/t) | Notes |
|---|---|---|---|
| Steel (flat/long) | BF-BOF | ~2.0 | Blast furnace route |
| Steel (flat/long) | EAF scrap | ~0.5 | Electric arc, recycled scrap |
| Primary aluminium | Smelting | ~1.5-2.1 (direct only) | Indirect electricity excluded from CBAM |
| Portland cement | Kiln | ~0.83 | Both direct and indirect priced |
| Urea fertiliser | Synthesis | ~2.3-2.6 | Both direct and indirect priced |
These are indicative figures for planning. Your actual obligation depends on verified supplier data or the applicable country-specific default under IR 2025/2621.
Input 3: The CBAM Factor
The CBAM factor is the percentage of embedded emissions that actually triggers a certificate obligation in a given year. It exists because EU producers in the covered sectors still receive free EU ETS allowances - and CBAM only charges for the share of free allocation that has been phased out.
In 2026, the CBAM factor is 2.5%, meaning 97.5% of free allocation remains in place. The factor rises steeply over the following years:
The full schedule: 2.5% (2026), 5% (2027), 10% (2028), 22.5% (2029), 48.5% (2030), 61% (2031), 73.5% (2032), 86% (2033), 100% (2034). The steepest single-year jump is between 2029 and 2030 - a more than doubling of the factor in 12 months. We cover the budget implications of that trajectory in our separate cost-trajectory post; the key point here is that the 2026 factor of 2.5% is the cheapest this mechanism will ever be.
Input 4: Certificate Price
The European Commission calculates the CBAM certificate price as the volume-weighted average of EU ETS auction clearing prices. In 2026, the Commission calculates and publishes four quarterly prices, one for each calendar quarter. Each quarterly price is calculated during the first calendar week after the quarter ends and applies to all CBAM imports made during that quarter.
Confirmed 2026 prices so far:
| Quarter | Certificate price | Published |
|---|---|---|
| Q1 2026 (Jan-Mar) | EUR 75.36 / tCO₂e | 7 April 2026 |
| Q2 2026 (Apr-Jun) | EUR 75.28 / tCO₂e | 6 July 2026 |
| Q3 2026 (Jul-Sep) | TBC | ~6 October 2026 |
| Q4 2026 (Oct-Dec) | TBC | ~5 January 2027 |
Sources: European Commission CBAM certificate price page; EUROMETAL Q1 2026; EUROMETAL Q2 2026.
The Q1-Q2 move of just EUR 0.08 looks stable, but it masks significant intra-quarter volatility in the underlying EU ETS market. EU ETS allowance prices rose above EUR 90/tCO₂e in January 2026 before falling to the low EUR 60s by mid-March. The quarterly averaging smooths that out in 2026. From 2027, the Commission moves to weekly CBAM certificate pricing, which means far greater exposure to short-term carbon market movements.
For budgeting Q3 and Q4 2026, use the most recent confirmed price as a planning assumption and update when the Commission publishes.
Worked Example A: Blast-Furnace Steel from Turkey
Scenario: A German machinery manufacturer imports 10,000 tonnes of hot-rolled coil from a Turkish BF-BOF mill in Q1 2026. The supplier has provided verified actual emissions data showing gross embedded emissions of 20,000 tCO₂ across the shipment - an emission intensity of 2.0 tCO₂ per tonne.
Step-by-step calculation:
Import volume × emission factor = 10,000 t × 2.0 tCO₂e/t = 20,000 tCO₂e
20,000 tCO₂e × 2.5% = 500 certificates required for Q1
500 certificates × EUR 75.36 = EUR 37,680
Turkey does not currently operate a qualifying carbon pricing scheme that would reduce this figure. No deduction applies. Q1 liability = EUR 37,680.
Annualised view (same volume, same emission factor, all four quarters at ~EUR 75/tCO₂e):
| Quarter | Certificates | Price | Quarterly cost |
|---|---|---|---|
| Q1 | 500 | EUR 75.36 | EUR 37,680 |
| Q2 | 500 | EUR 75.28 | EUR 37,640 |
| Q3 | 500 | TBC (~EUR 75) | ~EUR 37,500 |
| Q4 | 500 | TBC (~EUR 75) | ~EUR 37,500 |
| Full year | 2,000 | - | ~EUR 150,320 |
That is roughly EUR 15 per tonne of steel imported - a modest line item in 2026. The same shipment in 2030, with the CBAM factor at 48.5% and assuming the same EUR 75 certificate price, would cost approximately EUR 729,000 for the year - nearly five times more. That is why 2026 is the year to get your data infrastructure in place, not to treat the bill as negligible.
Worked Example B: Primary Aluminium - Why the Default Value Trap Bites Hardest Here
Scenario: A Dutch distributor imports 2,000 tonnes of unwrought primary aluminium (CN 7601) from a supplier in a country with a coal-heavy electricity grid. The supplier has not provided verified emissions data, so the importer must use default values.
The aluminium scope quirk you need to understand first
CBAM prices only direct emissions for aluminium - the electricity consumed in smelting (approximately 14-16 MWh per tonne) is excluded from the certificate obligation. A smelter powered by coal-fired electricity can carry 12-16 tCO₂e per tonne in total lifecycle terms, but CBAM only charges for the 1.5-2.1 tCO₂e from direct anode consumption and perfluorocarbon (PFC) emissions. This is a significant scope boundary that many importers misread.
However - and this is the trap - default values are set per country and production route, and they already incorporate the full carbon profile of the source country's grid in how they are calibrated. A country with a coal-heavy grid will have a higher default value than one with a cleaner grid, even though CBAM formally prices only direct emissions.
The calculation: default vs. actual
Assume the applicable country default for primary aluminium is 2.5 tCO₂e/t (a plausible figure for a coal-grid country), and the importer's supplier could demonstrate actual direct emissions of 1.6 tCO₂e/t if they provided verified data.
Using default values (with 10% mark-up in 2026):
- Adjusted default = 2.5 tCO₂e/t × 1.10 = 2.75 tCO₂e/t
- Total embedded emissions = 2,000 t × 2.75 tCO₂e/t = 5,500 tCO₂e
- Certificates required (Q1) = 5,500 × 2.5% = 137.5 certificates
- Cost = 137.5 × EUR 75.36 = EUR 10,362
Using verified actual data (no mark-up):
- Total embedded emissions = 2,000 t × 1.6 tCO₂e/t = 3,200 tCO₂e
- Certificates required (Q1) = 3,200 × 2.5% = 80 certificates
- Cost = 80 × EUR 75.36 = EUR 6,029
The default premium in Q1 alone: EUR 4,333 - a 72% overpayment versus what verified data would produce. Annualised across four quarters, that is over EUR 17,000 in unnecessary certificate costs on a 2,000-tonne import programme. And the mark-up rises to 20% in 2027 and 30% from 2028 - so the penalty for not having verified data compounds every year.
The default mark-up is not a rounding error. For aluminium importers sourcing from high-emission countries, the gap between default and actual can represent tens of thousands of euros per year at current volumes and the 2026 CBAM factor. At the 2030 factor of 48.5%, the same gap multiplies roughly 19-fold. Getting verified supplier data is not a compliance nicety — it is a direct cost reduction.
Why 2026 Is the Cheap Year - and Why That Makes It the Right Year to Act
The 2.5% CBAM factor means that in 2026, you are paying for just one euro in every forty of your gross embedded emissions liability. The full phase-in schedule - confirmed in Regulation (EU) 2023/956 and the CBAM Guide's free-allocation tracker - shows how steeply that changes:
The same 10,000-tonne steel shipment from Example A, held constant at EUR 75/tCO₂e, produces these annual costs as the factor rises:
| Year | CBAM factor | Annual certificate cost |
|---|---|---|
| 2026 | 2.5% | ~EUR 150,000 |
| 2027 | 5% | ~EUR 300,000 |
| 2028 | 10% | ~EUR 600,000 |
| 2029 | 22.5% | ~EUR 1,350,000 |
| 2030 | 48.5% | ~EUR 2,910,000 |
That is a 19-fold increase in six years on the same physical import programme, before any ETS price movement. The low 2026 bill is not a signal that CBAM is manageable long-term - it is a window to build the supplier data relationships and internal processes that will matter enormously from 2028 onward.
Use the Interactive Calculator
The worked examples above use fixed inputs. Your actual exposure depends on your specific products, suppliers, origin countries, and quarterly import volumes. Use the calculator below to plug in your own numbers.
Three Practical Steps Before Your First Declaration
The first annual CBAM declaration - covering all 2026 imports - is due by 30 September 2027. Certificate purchases open on 1 February 2027. That sounds distant, but the data you need to file accurately has to be collected now, quarter by quarter, as shipments arrive.
1. Get verified supplier data - now, not in 2027. Every quarter that passes without verified actual emissions data from your supplier is a quarter where you are accruing a liability based on default values with a 10% mark-up. Contact your non-EU suppliers and ask them to register on the European Commission's CBAM Operators Portal and upload their installation-level emissions data. This is the single highest-return action available to most importers in 2026.
2. Track your quarterly certificate price. The Q3 2026 price will be published around 6 October 2026; Q4 around 5 January 2027. Subscribe to price alerts so you can update your budget model as each price is confirmed. From 2027, prices move weekly - so the quarterly averaging that makes 2026 planning relatively straightforward disappears.
3. Build the escalating factor into your multi-year budget. The CBAM factor roughly doubles between 2026 and 2027, doubles again by 2028, and more than quadruples between 2028 and 2030. Finance teams that model only the 2026 bill will be caught off-guard. Use the formula above with the confirmed factor schedule to produce a five-year cost projection for your main import categories.
Quick Reference: The Formula in One Place
| Input | Where to find it | Common mistake |
|---|---|---|
| Import volume (t) | Customs declarations / ERP | Using gross weight instead of net mass |
| Emission factor (tCO₂e/t) | Verified supplier data or IR 2025/2621 defaults | Forgetting the 10% default mark-up in 2026 |
| CBAM factor (%) | Fixed by regulation: 2.5% in 2026 | Confusing the CBAM factor with the free allocation percentage (97.5%) |
| Certificate price (€/tCO₂e) | EC CBAM price page, published quarterly | Using an outdated or projected price instead of the confirmed quarterly figure |
The formula is simple. The inputs require discipline. The cost of getting them wrong - especially the emission factor - is real money, and it compounds as the CBAM factor rises through the decade.
Related reading
The UK-EU ETS Linkage Negotiation: What It Means for CBAM Exemption - and When
UK goods entering the EU face CBAM charges today - with no carve-out. The only route to exemption runs through ETS linkage. Here's the state of that negotiation, what it would actually change, and how to plan under uncertainty.
CBAM's Missing Half: What the Temporary Decarbonisation Fund Means for EU Exporters
CBAM equalises carbon costs on imports but leaves EU exporters exposed as free allocation disappears. This post explains the export carbon leakage gap, the proposed Temporary Decarbonisation Fund, and what exporters should do now.

CBAM and Customs Special Procedures: Why Inward Processing Defers Your Obligation, Not Cancels It
Inward processing doesn't exempt you from CBAM - it defers it. Here's exactly when the obligation triggers, what data you need to hold, and who must be the authorised declarant.