CBAM's Four Forgotten Sectors: Cement, Fertilisers, Hydrogen and Electricity
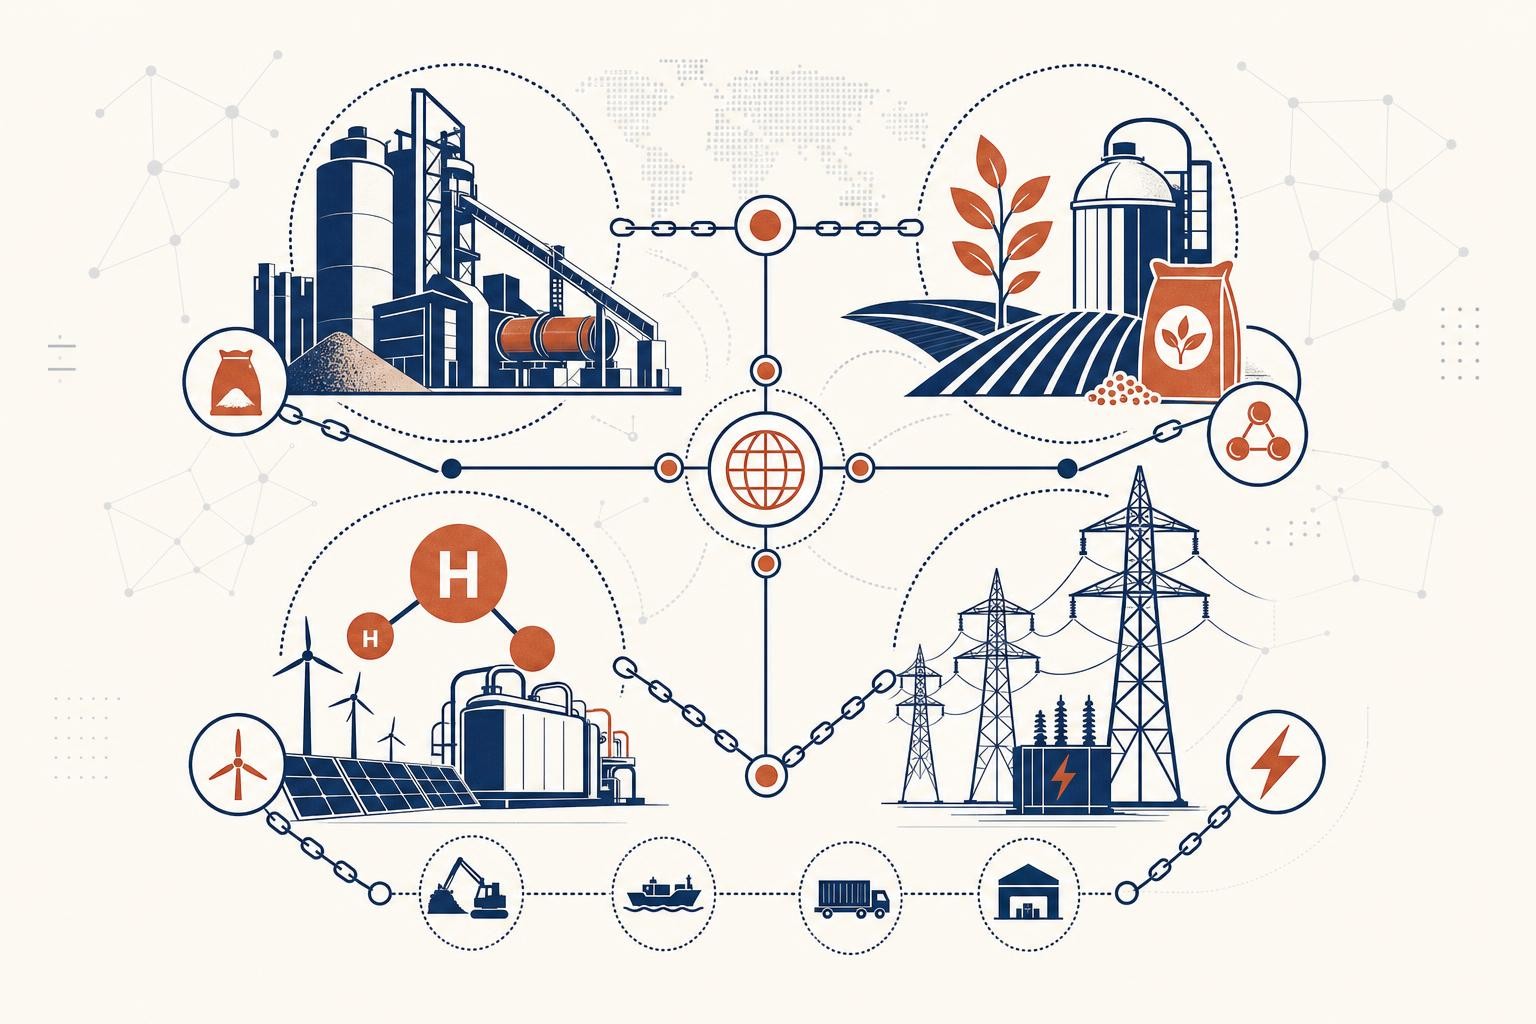
Steel and aluminium dominate the CBAM conversation. They're the sectors with the loudest industry lobbies, the most trade-press coverage, and the most visible supply-chain disruption. But four of the six covered carbon border adjustment sectors - cement, fertilisers, hydrogen, and electricity - are quietly generating real compliance exposure for EU importers who haven't looked closely enough.
This post covers those four sectors in depth: what makes each one distinct, the sector-specific traps that catch importers off guard, and what to do before the first annual declaration deadline of 30 September 2027.
The baseline you need to know
CBAM's definitive regime went live on 1 January 2026, covering six sectors: iron & steel, aluminium, cement, fertilisers, electricity, and hydrogen. The mechanism is now a financial obligation, not just a reporting exercise. On 7 April 2026, the European Commission published the first official CBAM certificate price at EUR 75.36 per tonne of CO₂e - the weighted average of EU ETS auction clearing prices for Q1 2026. In 2026, that price is set quarterly; from February 2027 it moves to a weekly calculation.
One more number matters before we get sector-specific: the CBAM factor. In 2026, importers pay only on 2.5% of embedded emissions, because EU domestic producers still receive 97.5% of their ETS free allowances. That factor rises steeply - reaching 48.5% by 2030 and 100% by 2034. The 2026 bill is modest; the 2030 bill is not.
Cement
Why it's more exposed than importers expect
Cement looks like a simple bulk commodity. It isn't, from a CBAM perspective. Limestone calcination - the chemical reaction CaCO₃ -> CaO + CO₂ - generates approximately 60% of cement's carbon footprint through unavoidable process chemistry. You cannot engineer that away with cleaner energy. It is baked into the product.
Portland cement carries approximately 0.83 tCO₂ per tonne, producing a gross CBAM cost of approximately €62.25 per tonne at €75/tCO₂. Blended cements using slag or fly ash carry lower emission factors - roughly 0.40-0.65 tCO₂/t - due to a reduced clinker ratio. If you import grey clinker specifically, your exposure is at the high end of that range.
Cement is also one of only two CBAM sectors where both direct and indirect emissions are priced. The electricity consumed in cement kilns is material to the total footprint and must be accounted for separately.
The default-value trap for cement
The default-value mark-up for cement is 10% in 2026, rising to 20% in 2027 and 30% from 2028 onwards. That escalation is the key reason to act now rather than later.
Here's what the numbers look like in practice. Take a 10,000-tonne shipment of grey clinker from Morocco. On the Commission's default emission factor (approximately 0.83 tCO₂/t) plus the 10% mark-up, the gross CBAM cost at EUR 75.36 is roughly EUR 270,000. With verified actual producer data showing a real-world emission intensity of around 0.8 tCO₂/t - no mark-up applies to actual values - the same shipment costs roughly EUR 120,000 less before the CBAM factor adjustment. That gap widens every year as the mark-up climbs and the CBAM factor ramps up.
Cement importers: ask your supplier for installation-level emissions data now. Verification by an accredited verifier is required to use actual values, but the saving versus default values is already material in 2026 and becomes compelling from 2028. The first physical verifier visit to the installation is required in year one — build that into your supplier engagement timeline.
Fertilisers
A complex emissions picture
Fertilisers are the most chemically complex of the four sectors covered here. All nitrogen fertilisers derive from ammonia produced via the Haber-Bosch process, with hydrogen currently sourced from natural gas in 99% of global production. That means the embedded emissions stack up across multiple production steps: steam methane reforming of natural gas, ammonia synthesis, and - for ammonium nitrate - nitric acid production.
Nitric acid production for ammonium nitrate generates N₂O, a greenhouse gas with a global warming potential of 265 (AR5, 100-year horizon). N₂O is priced under CBAM, not just CO₂. Importers who assume they're only dealing with carbon dioxide will underestimate their liability.
The emission intensities vary significantly by product:
| Product | Approx. emission factor (tCO₂e/t) | Gross CBAM cost (EUR/t) |
|---|---|---|
| Urea | ~2.5 | ~€187.50 |
| Ammonium nitrate (AN) | 1.5–2.0 | ~€112–150 |
| Urea-ammonium nitrate (UAN) solution | 1.0–1.5 | ~€75–112 |
| Ammonia (precursor) | varies by route | route-dependent |
Like cement, fertilisers are one of only two sectors where both direct and indirect emissions are priced. The electricity consumed during production must be calculated separately using the applicable grid emission factor for the installation's power source.
The CN-code mapping trap
The fertiliser sector has a wide range of in-scope CN codes - covering ammonia, nitric acid, urea, ammonium nitrate, mixed nitrogen fertilisers, and more. The EU CBAM focuses on nitrogen-containing fertiliser production and excludes potassium and phosphate fertilisers. Importers who buy mixed or blended products need to map each CN code carefully against Annex I of Regulation (EU) 2023/956 to confirm scope. Getting this wrong in either direction - assuming you're out of scope when you're not, or over-reporting - creates declaration errors.
One more fertiliser-specific detail: the default-value mark-up for fertilisers is capped at just 1% across all years, compared to 10-30% for cement, steel, and aluminium. That's because the Commission recognised the difficulty of obtaining actual data across complex chemical supply chains. The financial incentive to use actual values is therefore smaller for fertilisers than for other sectors - but the obligation to track and report embedded emissions is identical.
Hydrogen
The widest cost range of any CBAM sector
Hydrogen is unique because the production route determines almost everything. Grey hydrogen produced by steam methane reforming (SMR) without carbon capture carries approximately 9-12 tCO₂ per tonne of hydrogen, generating a gross CBAM cost of approximately €675-900 per tonne at €75/tCO₂. Green hydrogen produced via renewable electrolysis carries approximately zero embedded emissions - and therefore approximately zero CBAM cost.
That structural difference creates a growing commercial incentive for exporters in Morocco, Chile, Australia, and Saudi Arabia to develop certified green hydrogen supply chains for the EU market.
The no-exemption trap
This is the most important hydrogen-specific compliance trap: hydrogen is explicitly excluded from the 50-tonne de minimis exemption introduced by the Omnibus Simplification Package (Regulation (EU) 2025/2083). All imports of hydrogen, regardless of volume, are subject to full CBAM obligations from the very first import. There is no minimum threshold. A single kilogram of grey hydrogen imported into the EU triggers the full authorised declarant requirement, emissions tracking, and eventual certificate surrender.
If you import hydrogen and haven't yet applied for authorised CBAM declarant status, you are already non-compliant.
Electricity
A different calculation methodology
Electricity is the only CBAM sector with a single CN code (2716 00 00), and its compliance calculation works differently from every other sector. Rather than tracking embedded emissions from a production installation, electricity CBAM is based on the carbon intensity of the exporting country's grid - or, where a direct technical link or power purchase agreement (PPA) can be demonstrated, the actual emission factor of the generating source.
Carbon intensity defaults for electricity are set on a per-country basis, reflecting each exporting country's average grid carbon intensity. Countries connected to the EU grid via physical interconnectors - such as Ukraine, Morocco, and the UK - are the primary affected parties. If you import electricity through a physical interconnector from any of these countries, you are in scope.
The methodology is technically the most complex of the six sectors. Grid carbon intensity varies by hour, and the default values are based on weighted averages across all generation sources in the exporting country. Importers who can demonstrate a direct technical link to a specific low-carbon generator, or who have a qualifying PPA, may be able to use a lower actual emission factor - but the evidentiary requirements are strict.
The no-exemption trap (again)
Like hydrogen, electricity is explicitly excluded from the 50-tonne de minimis exemption. All imports of electricity, regardless of volume, are subject to full CBAM obligations - there is no minimum threshold under Article 2(3a) of Regulation (EU) 2023/956. A utility importing even a small volume of electricity from a non-EU grid via an interconnector must be an authorised CBAM declarant.
The de minimis exemption does NOT apply to electricity or hydrogen. The 50-tonne annual threshold — which exempts roughly 90% of importers of cement, fertilisers, steel, and aluminium — simply does not exist for these two sectors. If you import any volume of electricity or hydrogen from a non-exempt country, you need authorised declarant status from day one.
The default-value mark-up: a cross-sector summary
Across all four sectors, using the Commission's default emission values rather than verified actual data carries an escalating cost penalty. The mark-up structure is:
The fertiliser sector is the exception: its mark-up is capped at 1% across all years, reflecting the complexity of obtaining actual data in chemical supply chains. For cement and hydrogen, the financial case for investing in verified actual data is already present in 2026 and becomes compelling from 2028.
Next steps by sector
Check every CN code you import against Annex I of Regulation (EU) 2023/956. For fertilisers especially, not all nitrogen-related products are covered — and potassium and phosphate fertilisers are out of scope entirely.
If you import hydrogen or electricity in any volume, or more than 50 tonnes per year of cement or fertilisers, you need authorised declarant status. Applications are processed by your national competent authority (NCA) — allow up to 120 days.
For cement and hydrogen especially, the gap between default and actual values is large. Contact your non-EU producers now and ask for installation-level monitoring data. Verification by an accredited verifier is required before you can use actual values in your declaration.
If you import electricity, identify which interconnectors are involved and obtain the applicable country-level grid emission factor from the Commission's published default values (IR (EU) 2025/2621). If you have a qualifying PPA or direct technical link to a low-carbon generator, document it carefully.
The first annual CBAM declaration covers all 2026 imports and is due by 30 September 2027. Certificate purchases open from 1 February 2027. The data you collect throughout 2026 is the foundation — errors at this stage cascade through the certificate calculation and the quarterly holding requirement.
The four sectors covered here - cement, fertilisers, hydrogen, and electricity - each have their own emissions chemistry, their own calculation methodology, and their own compliance traps. The common thread is that the cost of getting it wrong grows every year as the CBAM factor ramps up and the default-value mark-up escalates. The time to build the data infrastructure is now, not in August 2027.
For the official sector-by-sector guidance, the European Commission's CBAM page is the authoritative source. For plain-English sector guides, emission factor tables, and a free scope checker, explore the tools at CBAM Navigator.
Related reading
The UK-EU ETS Linkage Negotiation: What It Means for CBAM Exemption - and When
UK goods entering the EU face CBAM charges today - with no carve-out. The only route to exemption runs through ETS linkage. Here's the state of that negotiation, what it would actually change, and how to plan under uncertainty.
CBAM's Missing Half: What the Temporary Decarbonisation Fund Means for EU Exporters
CBAM equalises carbon costs on imports but leaves EU exporters exposed as free allocation disappears. This post explains the export carbon leakage gap, the proposed Temporary Decarbonisation Fund, and what exporters should do now.
CBAM and Customs Special Procedures: Why Inward Processing Defers Your Obligation, Not Cancels It
Inward processing doesn't exempt you from CBAM - it defers it. Here's exactly when the obligation triggers, what data you need to hold, and who must be the authorised declarant.